Semi-automated analysis of podosome reformation using ImageJ
Here, we describe assays that enable the measurement of podosome dynamics, namely reformation of podosomes, in fixed cells. The assay is based on the key influence of Src kinase on podosome formation and turnover, and use the general Src kinase inhibitor PP2 as a tool to disrupt podosomes (Linder et al. J. Cell Sci.,2000), which enables the analysis of synchronised reformation of podosomes.

Gallery of confocal micrographs from macrophages stained for F-actin using Alexa488-labeled phalloidin to label podosomes (green), stained with CellMask to highlight individual cells (red), after application of the described ImageJ macro for cell (C), and after using the ROI mask to correlate podosomes (black dots) with individual cells (red outlines and numbers; D). Images show untreated cells. Note that use of the ImageJ “ROI manager” tool allows the combination or deletion of ROIs in case of oversegmentation. (i.e., ROI 7 in D (centre) is obtained by merging 2 segmented objects belonging to a single cell. White scale bar = 10 µm. (Cervero, P et al., Adhesion Protein Protocols, 3rd edition in the Methods in Molecular Biology Series, 2013) Click image to enlarge.
The following steps (in Italics) have been recorded in a macro.txt using ImageJ (http://rsbweb.nih.gov/ij/), therefore can be copy/pasted in a .txt file and then opened with ImageJ or carried out one by one manually (using the respective tools).
Clearly all the steps can be fine tuned, depending on the microscope settings and/or the user needs, and the basic imaging principles can be used with any imaging software.
It’s very important to calibrate the scale depending on the microscope settings, before applying any imaging tool !
Cell mask macro steps:
run(„8-bit“);
run(„Smooth“);
run(„Gamma…“, „value=0.40“);
run(„Median…“, „radius=4“);
run(„Gaussian Blur…“, „sigma=4“);
run(„Make Binary“);
run(„Invert“);
run(„Watershed“);
run(„Analyze Particles…“, „size=150-Infinity circularity=0.30-1.00 show=Masks clear exclude add“);
This includes combining two segmented objects belonging to one single cell in case of oversegmentation (select the ROIs that need to be merged, right-click and select the “OR (Combine)” function followed by “Add”; this will create a single new ROI that will include the previously selected ones, which have to be deleted individually).
Moreover you can now set the values for calculation, for example cell area (Analyze>Set Measurements…>check only “Area”), then manually select all ROIs and click on “Measure”.
The obtained area values can be saved in a spreadsheet.
Once the ROIs corresponding to the cell positions are recorded, open the “podosome channel” (phalloidin stain) of the same image and run a series of actions which will allow highlighting and better definition of podosomes as individual, countable objects.
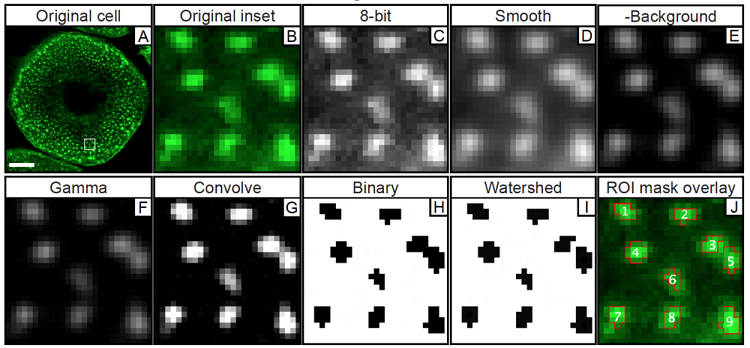
Overview over the main processing steps of the macro
Podosome macro steps:
run(„8-bit“);
run(„Smooth“);
run(„Subtract Background…“, „rolling=5“);
run(„Gamma…“, „value=1.30“);
run(„Convolve…“, „text1=[-1 -1 -1 -1 -1\n-1 -1 -1 -1 -1\n-1 -1 30 -1 -1\n-1 -1 -1 -1 -1\n-1 -1 -1 -1 -1\n] normalize“);
run(„Make Binary“);
run(„Watershed“);
run(„Analyze Particles…“, „size=0.10-50 circularity=0.80-1.00 show=Masks display“);
roiManager(„Show None“);
roiManager(„Show All“);
n = roiManager(„count“);
for (i=0; i<n; i++) {
roiManager(„select“, i);
run(„Find Maxima…“, „noise=0 output=Count light“);
}
After applying for a single picture these two macros, it will be possible to save the number of podosomes detected in each identified cell. These values, in combination with the values for cell area, can be used to calculate podosome density (here defined as number of podosomes/100 µm2 of cell covered area).
 |
“Cervero, P et al., Adhesion Protein Protocols, 3rd edition in the Methods in Molecular Biology Series, 2013” (ed. A Coutts), Springer.